
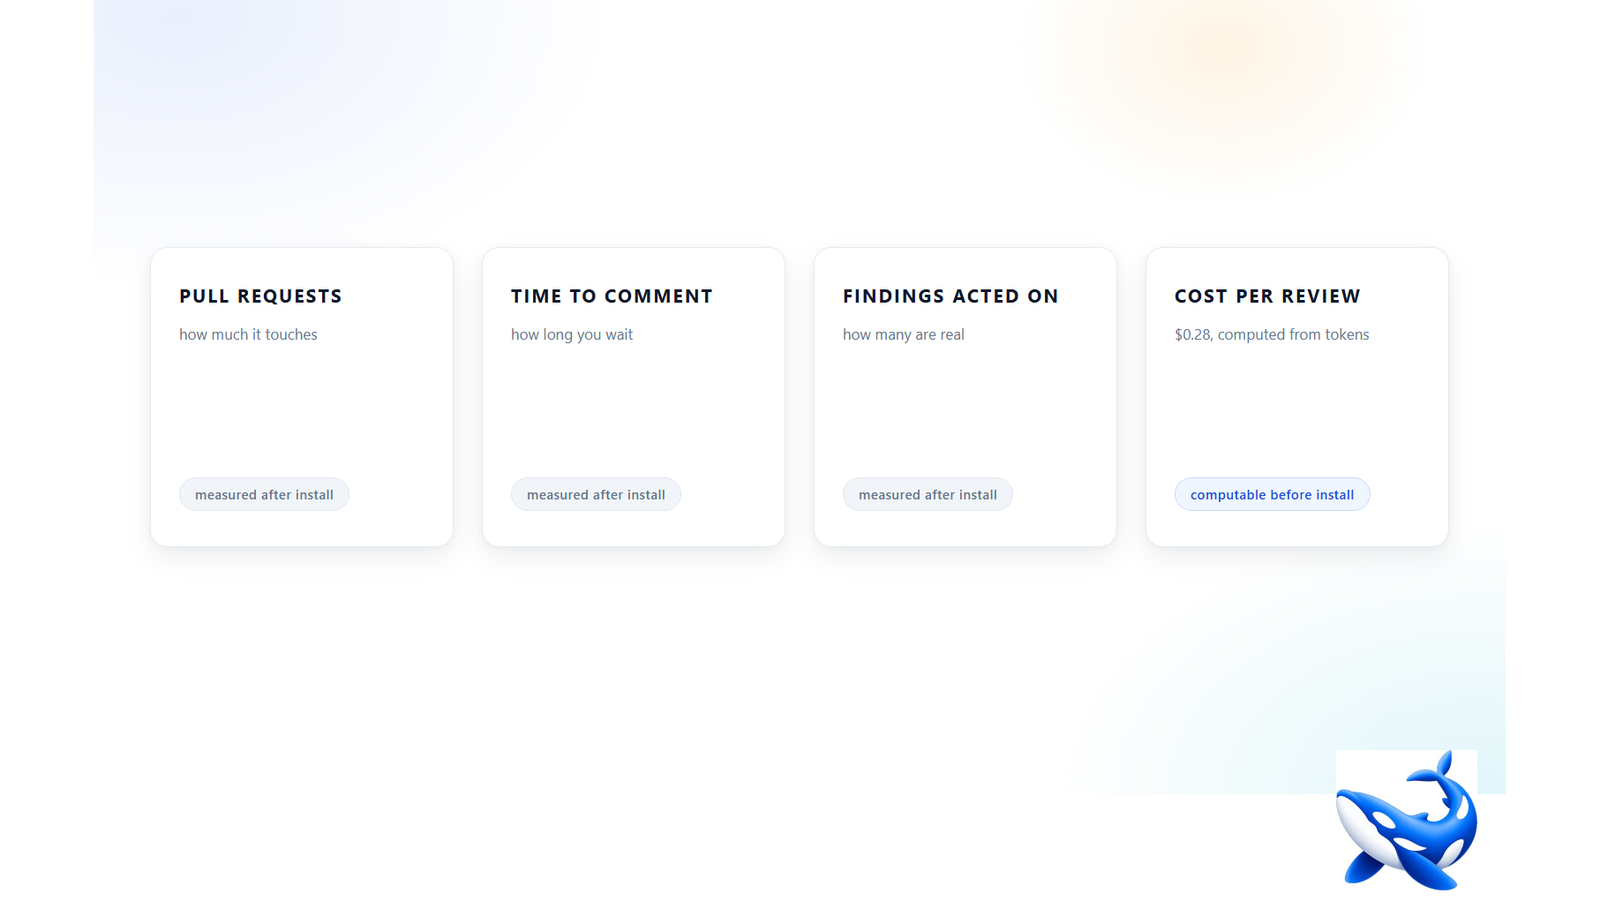
A review tool survives or dies on four numbers, and three of them cannot be known before it is installed. OrcaRouter runs an orca code review that is billed by the token instead of by the seat, and that choice changes the fourth number from a contract term into arithmetic: how many pull requests the reviewer touches, how long it takes to produce a comment, how many of its findings anyone acts on, and what a single review costs. The first three are measurable only inside your repository, after the fact and in aggregate. The fourth can be computed from published figures before anyone installs anything, which is the unusual part and the reason to start there.
The standard way to evaluate a review tool is a trial: switch it on for two weeks, count what it found, ask the team whether they liked it. Two weeks is long enough to measure enthusiasm and too short to measure the thing that actually decides the outcome, which is whether the comments keep being right in month four. A reviewer that is noisy in week one gets muted in week three, and a muted reviewer costs nothing per seat and returns nothing at all. That is why the ordering matters: the one number you can compute up front is the one that tells you what the other three are going to cost you to find out.
Four numbers a review produces
Take them one at a time, because they have different owners. The pull request count is a usage fact: how many diffs the reviewer opened, and how many of those it chose not to comment on at all. The time to comment is a harness fact, set by how many model calls the review fans out into and how much of that fan-out runs concurrently. The acted-on share is a human fact, and it is the only one of the four that a vendor cannot improve by shipping code. The cost is a token fact, and it is the only one that can be settled in advance.
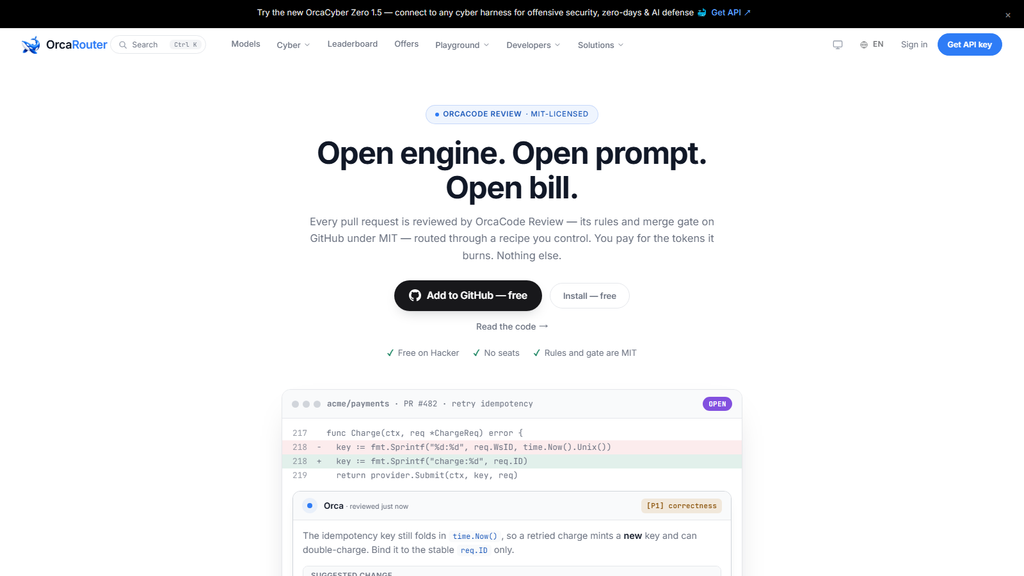
The page states three properties at the top of it — the engine and the prompt are open, and the bill is metered — and each one maps onto a different column of that list. An open prompt makes the second number diagnosable rather than mysterious: when a review misses something, the sentence that should have caught it is readable. A metered bill makes the fourth number a rate times a volume instead of a monthly subscription, which is what makes it computable at all.
Why the finding count is the weakest of the four
Counting findings feels like measuring quality, and it is the number most likely to mislead. A reviewer tuned to report everything produces a large finding count and a small acted-on share; a reviewer tuned to report almost nothing produces the reverse. Both numbers move together, so either one alone is a measure of tuning rather than of usefulness, which is why review tools quote finding counts and rarely quote the ratio.
The ratio is the honest metric, and it needs a denominator nobody advertises. A more useful pair is findings per pull request alongside the share of pull requests that produced no finding at all — a reviewer that comments on every diff is one nobody reads, and the fastest way to detect that is to count the silent pull requests rather than the loud ones. Neither figure is available before install. Both are available from the tool’s own comment history once it has run for a month, which is the point at which a team has usually already formed an opinion it cannot support.
Severity vocabulary is what makes the ratio computable. A comment tagged with a fixed severity class — the demonstration on the page uses `P1` for a correctness finding — can be counted, grouped and trended. A comment that says a change “might be worth a look” cannot be counted at all. The vocabulary is a harness property, defined by the review system rather than produced by the model, and a team that wants to measure its reviewer should require one.
Cost per pull request is a token fact
Start with the token shape rather than the price, because the price is downstream of it. On the vendor’s measured runs, the default recipe issues about 250 model calls at roughly 35,000 tokens each, with 96% of that input served from cache and billed at 10% of the input rate [OURS, read 2026-10-14]. Multiply the first two together and one review moves about 8.75 million input tokens; apply the cache share and the billable equivalent falls to roughly 1.2 million full-rate input tokens. That is the quantity a rate gets applied to, and it is the reason the published per-review figure lands at about $0.28 [OURS] rather than at the several dollars a naive reading of 8.75 million tokens would suggest.
The consequence is that cost per pull request is not a property of the model. Change the model behind the same harness and you multiply a fixed volume by a new rate; change the harness and you change the volume itself, which is the larger lever and the one a per-seat price hides entirely. A seat-priced tool has the same monthly line whether the team opens forty pull requests or four hundred, which means the tool’s cost and the team’s review volume are unrelated quantities. A metered tool couples them, and the coupling is what makes the number worth computing before the trial rather than after it.
Two published anchors make the arithmetic checkable rather than plausible. The measured runs are billed at $0.147 per million input tokens and $0.295 per million output tokens on the row the page names [OURS], and cached input is billed at a tenth of the input rate, which is the multiplier applied above. Anyone with a calculator and those three numbers can reproduce the per-review figure and then apply it to their own pull request volume, at which point the trial becomes a confirmation rather than an experiment.
The numbers have to be readable after the fact
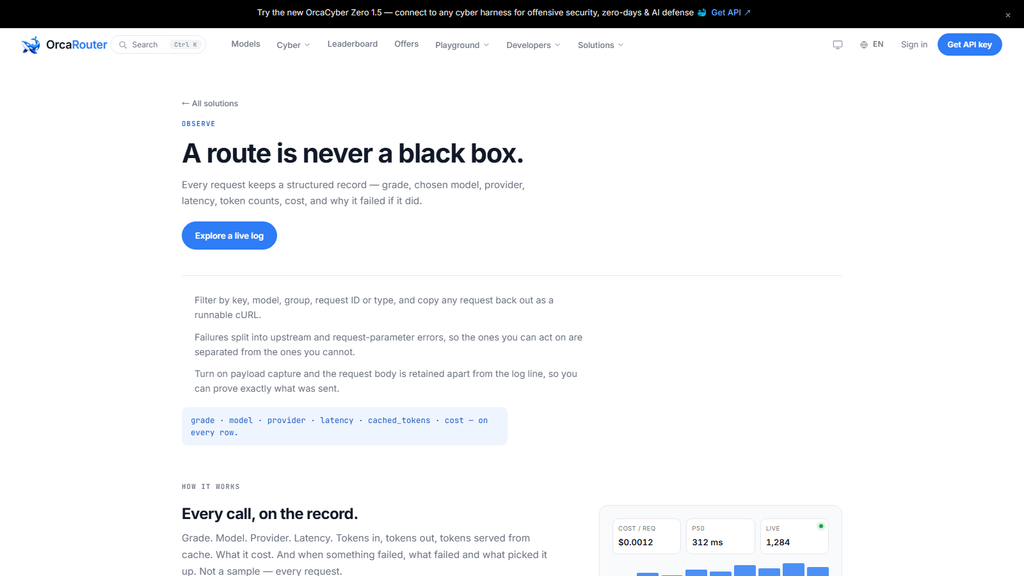
None of the preceding helps if the figures are only visible in an invoice. The cost of a review has to sit next to the thing that caused it — the model that was chosen, the tokens that were billed, the cache share that was realised — or a month that cost more than expected is a month nobody can explain.
On a gateway, that pairing is a request log: each call records the model, the latency and the cost alongside the routing decision that selected the row [OURS]. Applied to a review, the same log answers the questions a review tool’s own dashboard usually cannot: which pull request was expensive, and whether the expense came from a large diff or from a cache share that collapsed. The second question is the one worth tracking, because cache share is the only term in the arithmetic that a team can move without changing anything a reviewer can see.
What a review cannot measure about itself
Two of the four numbers have a floor that no tool can raise. The first is the quality of the row doing the reasoning: a review that routes a subtle concurrency bug to a small model will report what a small model can see, and the token cost of that call is trivially low, which is exactly the trap. The provider pages put the cheapest input rate at $0.020 per million on one catalogue and $1.25 on another [VENDOR, read 2026-10-14], and the cheapest row is not the right row for every diff any more than the dearest one is.
The second is the reviewer’s own blind spot. A tool reports what its prompt asked for. Every finding it produces is evidence about the prompt, and a finding it never produced is evidence about nothing — the absence of a comment is not a statement that the code is correct. That asymmetry is permanent, and it is why the acted-on share is worth more attention than the total: it is the only number in the set that measures agreement between a machine and the people who have to live with the merge.
The takeaway
Compute the fourth number first, because it is the only one of the four that does not require a trial. 250 calls at 35,000 tokens each, 96% of the input from cache at a tenth of the rate, and a per-review figure of about $0.28 [OURS] — multiply that by the team’s monthly pull request count and the cost question is closed before anything is installed. Then run the trial to answer the other three, and judge it on the ratio of findings to acted-on findings rather than on the finding count. A reviewer that is cheap and unread is the most expensive kind, and the arithmetic above will not tell you which one you have. The comment history will.
Sourcing note: the call count, token size, cache share, per-review figure, the rates used in the measured runs and the absence of seat pricing are the vendor’s own published account of its product and its measured runs, read 2026-10-14 [OURS]; the effective-billable-token figure is arithmetic performed on those published numbers, not a separate measurement. The request-log description is the vendor’s own published account of its product [OURS]. Cheapest-input rates and per-million-token prices on the provider pages are vendor-published [VENDOR], read 2026-10-14. The severity tag shown is from the vendor’s published demonstration.